RSI Divergence Histogram (Real Time)Simple and beautiful real time RSI Divergence Histogram.
Defined and highlighted "overbought" and "oversold" RSI-levels set in the input section of the indicator.
Tiny triangle marker shows pivot high and low.
Plotted Bearish and Bullish Divergence with a colored line in real time.
Yellow triangle shows overbought with bearish candlesticks and oversold with bullish candlesticks.
設定画面で定義した売られ過ぎ、買われ過ぎに達したヒストグラムをハイライトします。
小さい三角マークでダイバージェンス判定に使われるピボットハイ・ローを示します。
ダイバージェンス・ラインをリアルタイムに表示します。
売られすぎ時に陽線が出た場合、買われすぎ時に陰線が出たヒストグラムを黄色の三角で示します。
Cerca negli script per "rsi divergence"

RSI Divergence Histogram
Simple and beautiful RSI Divergence Histogram.
Defined and highlighted "overbought" and "oversold" RSI-levels set in the input section of the indicator.
Tiny triangle marker shows pivot high and low.
Plotted Bearish and Bullish Divergence with a colored line.
Yellow triangle shows overbought with bearish candlesticks and oversold with bullish candlesticks.
Background color shows the switching buy or sell power.
No alert.
設定画面で定義した売られ過ぎ、買われ過ぎに達したヒストグラムをハイライトします。
小さい三角マークでダイバージェンス判定に使われるピボットハイ・ローを示します。
ダイバージェンス・ラインを表示します。
売られすぎ時に陽線が出た場合、買われすぎ時に陰線が出たヒストグラムを黄色の三角で示します。
買いと売りの勢力が反転した際に、背景色を着色します。
アラート機能はありません。

RSI Divergence - eddetect RSI divergence
customizable RSI and divergence window length and also divergence source (close or wick of price)

Liens Standar Rsi - Divergence Rsi Divergence
This script is signaling
Bearish Divergence
Bullish Divergence
Hidden Bearish Divergence
Hidden Bullish Divergence
Alerts for all conditions.
RSI Divergence with candle coloringHey there
This is a script requested by a friend
It's based on the RSI Divergence script from Ricardos Santos :
This version will color the candles instead of drawing an extra panel below the main chart
I set this script on Invite-only cause it's only for a friend to be used.
However, if interested, hit me up and I'll add you
Enjoy
Dave

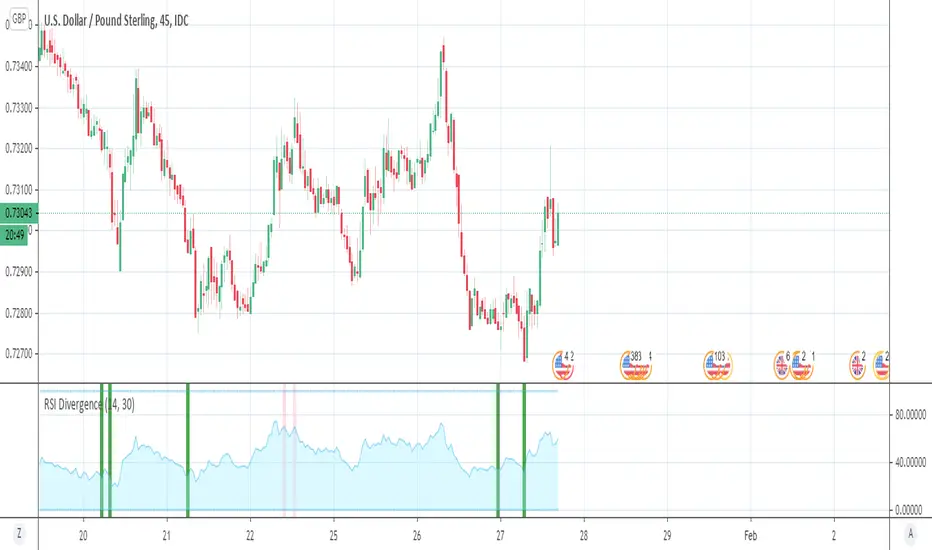
RSI DivergenceSimple RSI Divergence with adjustable lookback period.
Highlights bars with higher price but lower RSI (bearish) or lower price but higher RSI (bullish) than the highest/lowest points in the lookback period.
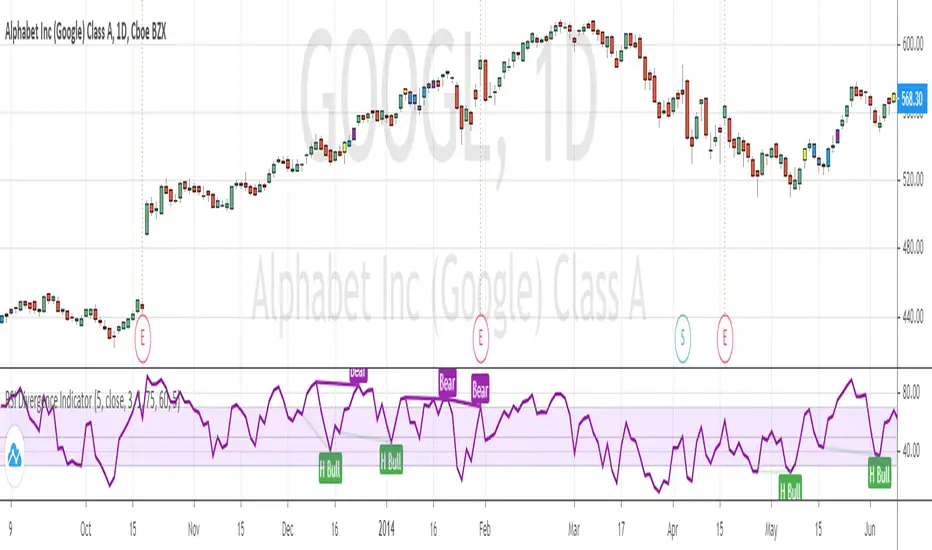
RSI DivergenceHi!
Lately I had quite a few requests for an RSI divergence development, so I decided to make a publish version of such indicator. This is how it works:
It searches for peaks on the RSI indicator (not on the price!):
when the RSI values greater than two values before and after that value it's a peak
when the RSI values lesser than two values before and after that value it's a trough
NOTE: The peak/trough could be detected only after two new bars are formed!
The indicator remembers high/low price on the bar with the peak/trough. When the indicator value at the peak is lower than the indicator value at the previous peak and the low price at the current peak is higher than the low price at last peak then it's a hidden bullish. Vice versa for the trough.
So, this indicator can detect the next cases:
indicator fall + high rise = regular bearish
indicator rise + high fall = hidden bearish
indicator rise + low fall = regular bullish
indicator fall + low rise = hidden bullish
You can donate ETH (0xa961e3866f58c36aaef958714d4f75d9c081b8bc) if you want to thank me more than just a like or a comment.


RSI Divergence Indicator (with alerts)Many have requested me for indicator version with alerts for the RSI Divergence strategy. Here is the one ...
Please note alert triggers in delay by number of bars defined in the settings. (same as strategy) ...
Bar color also changes when alert triggers ...
Yellow Bar shows BUY
Purple Bar shows EXIT ( Exit the Long position ... NO SHORTing )
On each Yellow Bar can be added to existing position
On each Purple Bar , exit partial position OR exit the whole position
Appreciate your feedback.
Warning
Use for education purpose only ...

Bullish B's - RSI Divergence StrategyThis indicator strategy is an RSI (Relative Strength Index) divergence trading tool designed to identify high-probability entry and exit points based on trend shifts. It utilizes both regular and hidden RSI divergence patterns to spot potential reversals, with signals for both bullish and bearish conditions.
Key Features
Divergence Detection:
Bullish Divergence: Signals when RSI indicates momentum strengthening at a lower price level, suggesting a reversal to the upside.
Bearish Divergence: Signals when RSI shows weakening momentum at a higher price level, indicating a potential downside reversal.
Hidden Divergences: Looks for hidden bullish and bearish divergences, which signal trend continuation points where price action aligns with the prevailing trend.
Volume-Adjusted Entry Signals:
The strategy enters long trades when RSI shows bullish or hidden bullish divergence, indicating an upward momentum shift.
An optional volume filter ensures that only high-volume, high-conviction trades trigger a signal.
Exit Signals:
Exits long positions when RSI reaches a customizable overbought level, typically indicating a potential reversal or profit-taking opportunity.
Also closes positions if bearish divergence signals appear after a bullish setup, providing protection against trend reversals.
Trailing Stop-Loss:
Uses a trailing stop mechanism based on ATR (Average True Range) or a percentage threshold to lock in profits as the price moves in favor of the trade.
Alerts and Custom Notifications:
Integrated with TradingView alerts to notify the user when entry and exit conditions are met, supporting timely decision-making without constant monitoring.
Customizable Parameters:
Users can adjust the RSI period, pivot lookback range, overbought level, trailing stop type (ATR or percentage), and divergence range to fit their trading style.
Ideal Usage
This strategy is well-suited for trend traders and swing traders looking to capture reversals and trend continuations on medium to long timeframes. The divergence signals, paired with trailing stops and volume validation, make it adaptable for multiple asset classes, including stocks, forex, and crypto.
Summary
With its focus on RSI divergence, trailing stop-loss management, and volume filtering, this strategy aims to identify and capture trend changes with minimized risk. This allows traders to efficiently capture profitable moves and manage open positions with precision.
This Strategy BEST works with GLD!

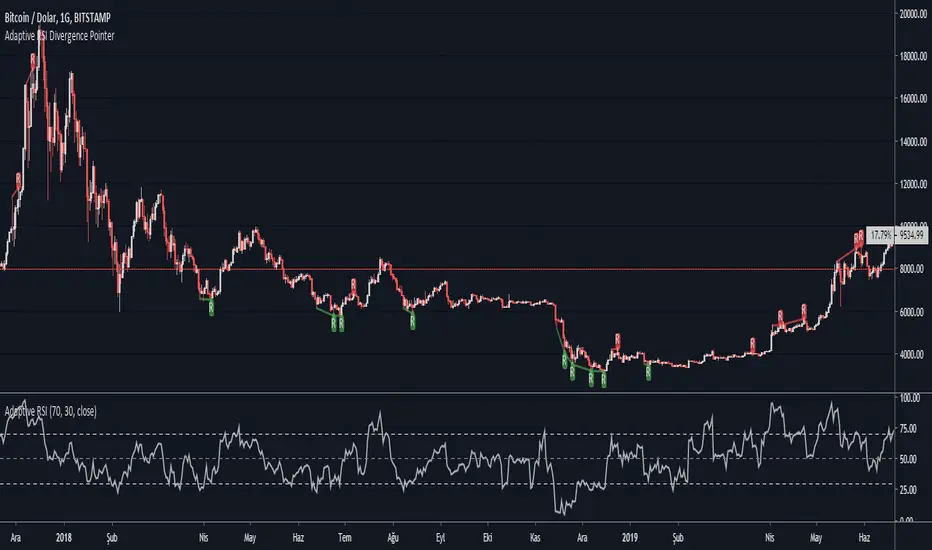
Adaptive RSI Divergence PointerThis script points regular and optionally hidden types of bullish and bearish Adaptive RSI divergences on the chart by drawing the divergence lines and optionally labels.
Hidden divergence is disabled by default, it can be enabled over settings window.
Regular divergence is enabled by default, it can be disabled over settings window.
There is an option to display the price channel additionally.
Added alerts for all types of divergences.
What is Adaptive RSI :
This is an implementation of John Ehlers’ Adaptive RSI , as described in his book Rocket Science for Traders: Digital Signal Processing Applications (2001-07-20).
It does not need a length value to be specified by user. It adopts itself perfectly to the price chart.
It integrates the idea of automatically determining the Dominant price cycle through a Homo-dyne Discriminator, and using half of a cycle length as the input for the RSI . Not only determines the most effective range for the RSI by setting it based on the cycle, but also makes the RSI PDF (Probability Distribution Function) adjustable as shown in John Ehler's papers.
Works just like a normal RSI , but should have less false signals.
Wilder's RSI + DivergencesWilder's RSI + Divergences
Description:
The Wilder's RSI + Divergences study is a powerful tool for traders using the TradingView platform. This custom Pine Script study combines Wilder's Relative Strength Index (RSI) with the identification of regular and hidden divergences, providing valuable insights into potential market reversals and trend changes. This comprehensive study includes the calculation of the RSI using Wilder's smoothing method, the plotting of the RSI and its Exponential Moving Average (EMA), and the detection of divergences based on pivot points.
Key Features:
Wilder's RSI Calculation: The study accurately calculates the RSI using J. Welles Wilder Jr.'s well-known smoothing method, providing a reliable measure of the asset's price strength or weakness.
Regular Divergence Identification: The study automatically detects regular bullish and bearish divergences. Regular bullish divergences occur when the RSI forms a lower low while the price forms a higher low. Regular bearish divergences occur when the RSI forms a higher high while the price forms a lower high. These divergences can indicate potential trend reversals or trend continuation possibilities.
Hidden Divergence Identification: The study also identifies hidden bullish and bearish divergences. Hidden bullish divergences occur when the RSI forms a higher low while the price forms a lower low. Hidden bearish divergences occur when the RSI forms a lower high while the price forms a higher high. Hidden divergences often signal the continuation of an existing trend.
Customizable Parameters: The study allows users to customize various parameters, including the length of RSI calculation, the length of the RSI's EMA, the lookback periods for identifying pivot points, and the range for considering pivot points. Users can adjust these parameters to suit their trading strategies and preferences.
Visual Representation: The study plots the RSI, its EMA, and the identified regular and hidden divergences directly on the chart. This visual representation provides traders with a clear and intuitive understanding of potential trading opportunities.
Protecting the Source Code:
The source code for this study is protected to ensure its originality and maintain the integrity of the algorithm. By safeguarding the code, it prevents unauthorized distribution or modification, preserving the study's uniqueness and value. This protection ensures that the study remains exclusive to the TradingView platform, enhancing the user experience and maintaining the trust of traders who rely on this tool for their analysis and decision-making.
Instructions for Use:
Add the Wilder's RSI + Divergences study to your chart.
Customize the study parameters, such as RSI length, EMA length, lookback periods, and range, to align with your trading preferences.
Analyze the chart to identify regular and hidden divergences in the RSI. Regular bullish and bearish divergences indicate potential trend reversals, while hidden divergences suggest trend continuation possibilities.
Adjust your trading strategy or make informed decisions based on the identified divergences and the overall market context.
Note: This study is designed to be a valuable tool in your technical analysis process. It is essential to combine it with other indicators, price action analysis, and risk management techniques for comprehensive trading decisions.
By utilizing the Wilder's RSI + Divergences study, traders can gain deeper insights into market dynamics, identify potential trading opportunities, and make more informed trading decisions.

[Top] VWAP + RSI Divergence IndicatorThe “VWAP RSI Divergence Indicator” combines the Volume Weighted Average Price (VWAP), Relative Strength Index (RSI), divergence detection, and volume confirmation to identify high-probability trading opportunities.
How It Works:
The indicator integrates three powerful methodologies:
1. Volume Weighted Average Price (VWAP):
VWAP calculates an average price weighted by volume, providing critical insights into the fair value of an asset within the trading session.
Includes standard deviation bands (+1/-1 and +2/-2) around the VWAP, offering key levels of support, resistance, and price extremities.
2. Relative Strength Index (RSI):
A momentum oscillator that measures the speed and change of recent price movements.
RSI levels define overbought and oversold conditions, offering traders insight into potential reversal zones.
3. Divergence Detection:
Identifies divergences between price action and RSI, signaling potential reversals or continuations.
Detects both Regular Divergences (signifying potential reversals) and Hidden Divergences (indicating possible continuation of current trends).
Core Features:
Real-Time Divergence Detection: Automatically detects and clearly labels Regular and Hidden Divergences with included tooltips to help you identify trading opportunities.
VWAP and Standard Deviation Bands: Visualizes important dynamic support/resistance levels on the chart.
RSI-Based Heat Map: Offers intuitive heat map coloring between standard deviation bands, colored dynamically according to RSI levels and divergence activity.
Optional Volume-Based Candle Coloring: Enhances visual insight by coloring candles according to volume relative to a moving average.
Customizable Alerts: Provides alerts for divergences and standard deviation band breaches, enabling traders to act swiftly.
What Makes It Unique:
Integrated Divergence and VWAP Analysis: Unlike typical divergence indicators, this tool uniquely combines RSI divergence signals with VWAP analysis, enhancing signal reliability by considering both price momentum and volume-weighted price dynamics.
Dynamic RSI Heat Map and Volume Coloring: Incorporates advanced visual customization through dynamic coloring based on RSI levels and divergences, as well as volume-based bar coloring, designed to allow you to understand detailed information at a glance.
How to Use:
Identify Divergences: Watch for divergence labels indicating potential reversals (Regular Divergence) or continuations (Hidden Divergence).
Monitor VWAP Bands: Use VWAP bands as dynamic support/resistance levels, particularly observing price reactions at +1/-1 and +2/-2 standard deviation extremes.
Volume Confirmation: Combine divergence signals with volume-colored bars to confirm strength or weakness behind potential moves.
Leverage Alerts: Enable customizable alerts to stay promptly informed about key divergences and price extremes, ensuring timely decision-making.

Smart RSI Divergence PRO | Auto Lines + Alerts📌 Purpose
This indicator automatically detects Regular and Hidden RSI Divergences between price action and the RSI oscillator.
It plots divergence lines directly on the chart, labels signals, and includes alerts for automated monitoring.
🧠 How It Works
1. RSI Calculation
RSI is calculated using the selected Source (default: Close) and RSI Length (default: 14).
2. Divergence Detection via Fractals
Swing points on both price and RSI are detected using fractal logic (5-bar patterns).
Regular Divergence:
Bearish: Price forms a higher high, RSI forms a lower high.
Bullish: Price forms a lower low, RSI forms a higher low.
Hidden Divergence:
Bearish: Price forms a lower high, RSI forms a higher high.
Bullish: Price forms a higher low, RSI forms a lower low.
3. Auto Drawing Lines
Lines are drawn automatically between divergence points:
Red = Regular Bearish
Green = Regular Bullish
Orange = Hidden Bearish
Blue = Hidden Bullish
Line width and transparency are adjustable.
4. Labels and Alerts
Labels mark divergence points with up/down arrows.
Alerts trigger for each divergence type.
📈 How to Use
Use Regular Divergences to anticipate trend reversals.
Use Hidden Divergences to confirm trend continuation.
Combine with support/resistance, trendlines, or volume for higher probability setups.
Recommended Timeframes: Works on all timeframes; more reliable on 1h, 4h, and Daily.
Markets: Forex, Crypto, Stocks.
⚙️ Inputs
Source (Close, HL2, etc.)
RSI Length
Toggle Regular / Hidden Divergence visibility
Toggle Lines / Labels
Line Width & Line Transparency
⚠️ Disclaimer
This script is for educational purposes only. It does not constitute financial advice.
Always test thoroughly before using in live trading.

Advanced Gold Scalping Strategy with RSI Divergence# Advanced Gold Scalping Strategy with RSI Divergence
## Overview
This Pine Script implements an advanced scalping strategy for gold (XAUUSD) trading, primarily designed for the 1-minute timeframe. The strategy utilizes the Relative Strength Index (RSI) indicator along with its moving average to identify potential trade setups based on divergences between price action and RSI movements.
## Key Components
### 1. RSI Calculation
- Uses a customizable RSI length (default: 60)
- Allows selection of the source for RSI calculation (default: close price)
### 2. Moving Average of RSI
- Supports multiple MA types: SMA, EMA, SMMA (RMA), WMA, VWMA, and Bollinger Bands
- Customizable MA length (default: 3)
- Option to display Bollinger Bands with adjustable standard deviation multiplier
### 3. Divergence Detection
- Implements both bullish and bearish divergence identification
- Uses pivot high and pivot low points to detect divergences
- Allows for customization of lookback periods and range for divergence detection
### 4. Entry Conditions
- Long Entry: Bullish divergence when RSI is below 40
- Short Entry: Bearish divergence when RSI is above 60
### 5. Trade Management
- Stop Loss: Customizable, default set to 11 pips
- Take Profit: Customizable, default set to 33 pips
### 6. Visualization
- Plots RSI line and its moving average
- Displays horizontal lines at 30, 50, and 70 RSI levels
- Shows Bollinger Bands when selected
- Highlights divergences with "Bull" and "Bear" labels on the chart
## Input Parameters
- RSI Length: Adjusts the period for RSI calculation
- RSI Source: Selects the price source for RSI (close, open, high, low, hl2, hlc3, ohlc4)
- MA Type: Chooses the type of moving average applied to RSI
- MA Length: Sets the period for the moving average
- BB StdDev: Adjusts the standard deviation multiplier for Bollinger Bands
- Show Divergence: Toggles the display of divergence labels
- Stop Loss: Sets the stop loss distance in pips
- Take Profit: Sets the take profit distance in pips
## Strategy Logic
1. **RSI Calculation**:
- Computes RSI using the specified length and source
- Calculates the chosen type of moving average on the RSI
2. **Divergence Detection**:
- Identifies pivot points in both price and RSI
- Checks for higher lows in RSI with lower lows in price (bullish divergence)
- Checks for lower highs in RSI with higher highs in price (bearish divergence)
3. **Trade Entry**:
- Enters a long position when a bullish divergence is detected and RSI is below 40
- Enters a short position when a bearish divergence is detected and RSI is above 60
4. **Position Management**:
- Places a stop loss order at the entry price ± stop loss pips (depending on the direction)
- Sets a take profit order at the entry price ± take profit pips (depending on the direction)
5. **Visualization**:
- Plots the RSI and its moving average
- Draws horizontal lines for overbought/oversold levels
- Displays Bollinger Bands if selected
- Shows divergence labels on the chart for identified setups
## Usage Instructions
1. Apply the script to a 1-minute XAUUSD (Gold) chart in TradingView
2. Adjust the input parameters as needed:
- Increase RSI Length for less frequent but potentially more reliable signals
- Modify MA Type and Length to change the sensitivity of the RSI moving average
- Adjust Stop Loss and Take Profit levels based on current market volatility
3. Monitor the chart for Bull (long) and Bear (short) labels indicating potential trade setups
4. Use in conjunction with other analysis and risk management techniques
## Considerations
- This strategy is designed for short-term scalping and may not be suitable for all market conditions
- Always backtest and forward test the strategy before using it with real capital
- The effectiveness of divergence-based strategies can vary depending on market trends and volatility
- Consider using additional confirmation signals or filters to improve the strategy's performance
Remember to adapt the strategy parameters to your risk tolerance and trading style, and always practice proper risk management.

Big Candle Identifier with RSI Divergence and Advanced Stops1. Strategy Objective
The main goal of this strategy is to:
Identify significant price momentum (big candles).
Enter trades at opportune moments based on market signals (candlestick patterns and RSI divergence).
Limit initial risk through a fixed stop loss.
Maximize profits by using a trailing stop that activates only after the trade moves a specified distance in the profitable direction.
2. Components of the Strategy
A. Big Candle Identification
The strategy identifies big candles as indicators of strong momentum.
A big candle is defined as:
The body (absolute difference between close and open) of the current candle (body0) is larger than the bodies of the last five candles.
The candle is:
Bullish Big Candle: If close > open.
Bearish Big Candle: If open > close.
Purpose: Big candles signal potential continuation or reversal of trends, serving as the primary entry trigger.
B. RSI Divergence
Relative Strength Index (RSI): A momentum oscillator used to detect overbought/oversold conditions and divergence.
Fast RSI: A 5-period RSI, which is more sensitive to short-term price movements.
Slow RSI: A 14-period RSI, which smoothens fluctuations over a longer timeframe.
Divergence: The difference between the fast and slow RSIs.
Positive divergence (divergence > 0): Bullish momentum.
Negative divergence (divergence < 0): Bearish momentum.
Visualization: The divergence is plotted on the chart, helping traders confirm momentum shifts.
C. Stop Loss
Initial Stop Loss:
When entering a trade, an immediate stop loss of 200 points is applied.
This stop loss ensures the maximum risk is capped at a predefined level.
Implementation:
Long Trades: Stop loss is set below the entry price at low - 200 points.
Short Trades: Stop loss is set above the entry price at high + 200 points.
Purpose:
Prevents significant losses if the price moves against the trade immediately after entry.
D. Trailing Stop
The trailing stop is a dynamic risk management tool that adjusts with price movements to lock in profits. Here’s how it works:
Activation Condition:
The trailing stop only starts trailing when the trade moves 200 ticks (profit) in the right direction:
Long Position: close - entry_price >= 200 ticks.
Short Position: entry_price - close >= 200 ticks.
Trailing Logic:
Once activated, the trailing stop:
For Long Positions: Trails behind the price by 150 ticks (trail_stop = close - 150 ticks).
For Short Positions: Trails above the price by 150 ticks (trail_stop = close + 150 ticks).
Exit Condition:
The trade exits automatically if the price touches the trailing stop level.
Purpose:
Ensures profits are locked in as the trade progresses while still allowing room for price fluctuations.
E. Trade Entry Logic
Long Entry:
Triggered when a bullish big candle is identified.
Stop loss is set at low - 200 points.
Short Entry:
Triggered when a bearish big candle is identified.
Stop loss is set at high + 200 points.
F. Trade Exit Logic
Trailing Stop: Automatically exits the trade if the price touches the trailing stop level.
Fixed Stop Loss: Exits the trade if the price hits the predefined stop loss level.
G. 21 EMA
The strategy includes a 21-period Exponential Moving Average (EMA), which acts as a trend filter.
EMA helps visualize the overall market direction:
Price above EMA: Indicates an uptrend.
Price below EMA: Indicates a downtrend.
H. Visualization
Big Candle Identification:
The open and close prices of big candles are plotted for easy reference.
Trailing Stop:
Plotted on the chart to visualize its progression during the trade.
Green Line: Indicates the trailing stop for long positions.
Red Line: Indicates the trailing stop for short positions.
RSI Divergence:
Positive divergence is shown in green.
Negative divergence is shown in red.
3. Key Parameters
trail_start_ticks: The number of ticks required before the trailing stop activates (default: 200 ticks).
trail_distance_ticks: The distance between the trailing stop and price once the trailing stop starts (default: 150 ticks).
initial_stop_loss_points: The fixed stop loss in points applied at entry (default: 200 points).
tick_size: Automatically calculates the minimum tick size for the trading instrument.
4. Workflow of the Strategy
Step 1: Entry Signal
The strategy identifies a big candle (bullish or bearish).
If conditions are met, a trade is entered with a fixed stop loss.
Step 2: Initial Risk Management
The trade starts with an initial stop loss of 200 points.
Step 3: Trailing Stop Activation
If the trade moves 200 ticks in the profitable direction:
The trailing stop is activated and follows the price at a distance of 150 ticks.
Step 4: Exit the Trade
The trade is exited if:
The price hits the trailing stop.
The price hits the initial stop loss.
5. Advantages of the Strategy
Risk Management:
The fixed stop loss ensures that losses are capped.
The trailing stop locks in profits after the trade becomes profitable.
Momentum-Based Entries:
The strategy uses big candles as entry triggers, which often indicate strong price momentum.
Divergence Confirmation:
RSI divergence helps validate momentum and avoid false signals.
Dynamic Profit Protection:
The trailing stop adjusts dynamically, allowing the trade to capture larger moves while protecting gains.
6. Ideal Market Conditions
This strategy performs best in:
Trending Markets:
Big candles and momentum signals are more effective in capturing directional moves.
High Volatility:
Larger price swings improve the probability of reaching the trailing stop activation level (200 ticks).

KINSKI Multi RSI DivergenceThis extremely useful indicator combines several RSI variants (can be displayed simultaneously or alone) with many setting options. The RSI variants can also be displayed as an extra histogram, which provides additional valuable information. Furthermore, it is possible to set smoothing types, volume and stochastic based calculations for each variant.
Relative Strength Index (RSI)
The Relative Strength Index ( RSI ) is a momentum indicator that measures the extent of recent price changes to analyse overbought or oversold conditions. RSI values range from 0 to 100. In general, RSI divergence means that the RSI indicator is moving in the opposite direction compared to the price. So while the price is moving, the RSI is telling us in advance that we can expect a change in direction.
RSX Indicator
The RSX is the noise-free version of the more familiar RSI oscillator. Normally, any indicator can be smoothed by applying a moving average. However, a major disadvantage of such a method is that there is a time lag between the indicator and the price. The RSX indicator tries to do this without signal delay.
Money Flow Indicator (MFI)
The MFI is essentially the RSI with the added aspect of volume . Because of its close similarity to the RSI , the MFI can be used in very similar ways.
RSI Laguerre
The RSI Laguerre works in the same way as the classic RSI , but is more sensitive to recent prices. When it crosses the signal line at the value of 0.15 from the bottom to the top, a buy signal is created, while overbought markets have values of 0.75 or higher
Detection of divergences
The detection of divergences in the RSI is one of the most important functions of this indicator. The reason is that an divergence is a more reliable signal than the overbought and oversold indicators themselves. You get overbought and oversold signals all the time. However, the divergence is a rare event.
In general, divergence means that the RSI indicator is moving in the opposite direction compared to the price. So while the price is moving, the RSI is telling us in advance that we can expect a change in direction.
Positive divergence
A positive divergence is when the price trend has lower lows and lower highs, while the indicator does the opposite - higher highs and higher lows. The price continues to fall while the RSI indicator begins to rise.
Negative divergence
Negative divergence is the opposite of positive divergence. It applies to uptrends where the price reaches higher highs and higher lows. However, the RSI shows lower highs and lower lows - the price goes up but the RSI goes down. The price closes with higher highs and higher lows, while the indicator shows the opposite - lower lows and lower highs, confirming a negative divergence. As a result, there is a sharp decline in the price.
Have fun using and trying out this flexible indicator!

NPM Rsi DivergenceNPM RSI Divergence Indicator
The NPM RSI Divergence Indicator is a closed-source tool designed to help traders identify potential reversals and high-probability trade setups using divergence between price action and the Relative Strength Index (RSI). It highlights areas where momentum is weakening or strengthening, giving traders early signals of potential trend changes.
What it does
Detects divergences between RSI and price movement, indicating potential trend reversals or continuation.
Shows the strength or reliability of each divergence signal to help traders gauge probability.
Plots visual markers directly on the chart for easier recognition of potential setups.
Helps traders spot early exhaustion points in trends before price reverses or continues strongly.
How it works (concept-level)
Compares price highs/lows with RSI highs/lows to detect hidden or regular divergences.
Applies adaptive filtering to reduce false signals in choppy or low-volatility markets.
Aggregates divergence signals into clear visual markers and strength indicators.
Incorporates momentum context to highlight divergences that are more likely to produce actionable moves.
How to use it
1. Apply the indicator to your chosen symbol and timeframe.
2. Observe divergence markers and their strength indicators on the chart.
3. Confirm potential trade opportunities by considering trend direction and market context.
4. Use divergence signals to assist with trade entry, exit, or risk management decisions.
Alerts
Optionally set alerts when divergence signals appear or when the strength indicator exceeds a user-defined threshold.
Notes
Suitable for multiple markets, including forex, indices, crypto, and equities.
Can be used on intraday or swing trading timeframes depending on your trading strategy.
⚠️ Disclaimer: This script is for educational purposes only and is not financial advice. Trading involves risk, and you can lose money. Always test strategies on a demo account and practice proper risk management.

[CryptoWho] Simple RSI DivergencesSimple RSI Divergence tracker.
You can adjust the rsi period and the lock back period, also enable/disable hidden divergences.
BITSTAMP:BTCUSD

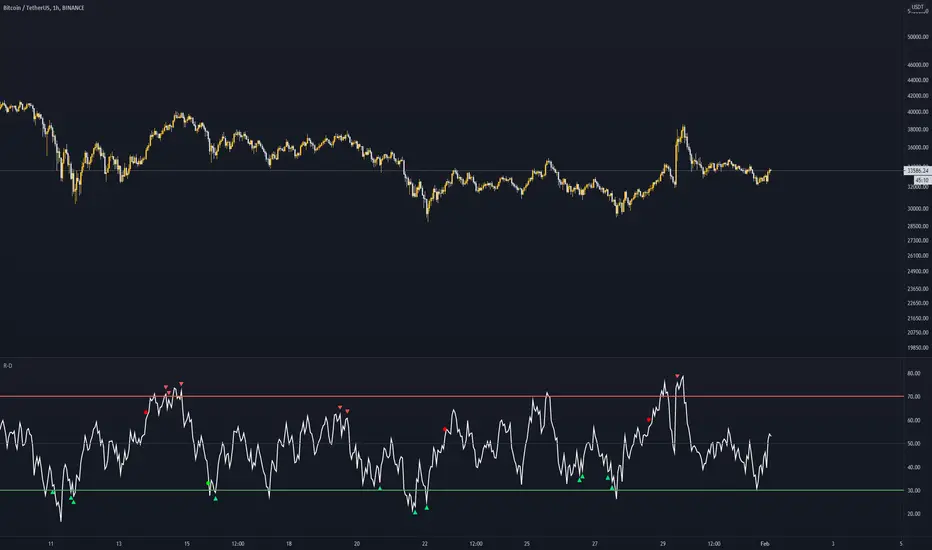
MG - Real time RSI divergenceShows RSI divergences in real time (as soon as bar closes in divergence instead of waiting for an RSI pivot).
There are alerts included on these events so you are immediately made aware of divergence.
Adjustement:
It works by detecting a break of a previous high or low and then comparing the RSI value at the last break to the current break. Therefore, by decreasing the adjacent candles required for a pivot, you increase the number of divergence checks and therefore divergence readings. As with many indicators, with higher the values, you get less but more significant signals. (This can be visualized with the plot pivot lines option)
RSI period can be adjusted

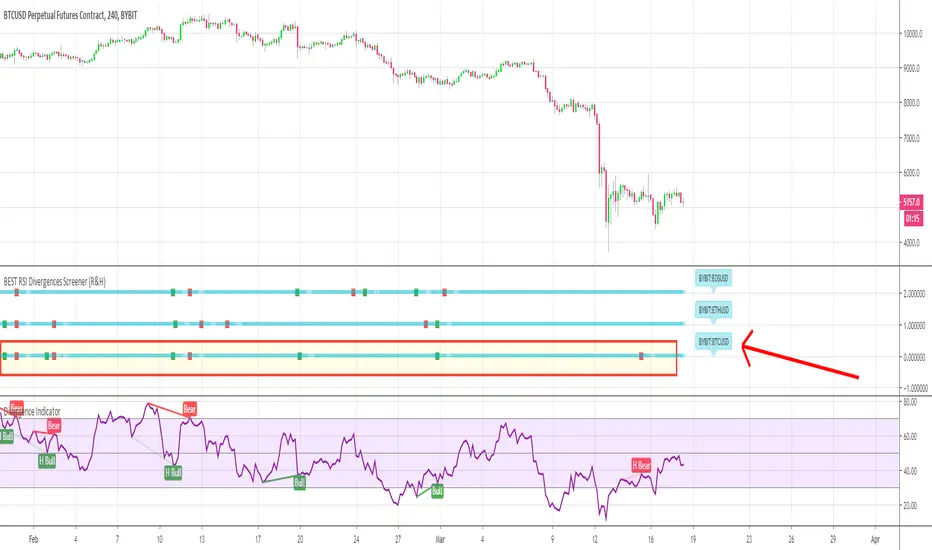
BEST RSI Divergences Screener (Regular and Hidden)Hello traders
My way to fight this situation is to stay productive.
Hope some of my scripts will help you out as most of us are locked-down at home, hence have more time for trading - and preparing ourselves when the sun will shine on us again
I - Concept
This is an upgrade of this script which captured only the regular divergences
This screener detects whether the regular RSI divergences based on the TradingView Divergence built-in indicator (made by the gentleman @everget I believe)
With this screener, you can see in 1 view which of your favorite cryptos/stocks/forex pairs/etc. showing strong regular and hidden divergences
The gentlemen (and demoiselles) traders can play with the lookback/ranges inputs to adjust the divergences based on what they think is best of their trading/timeframe/instrument/life
On that script screenshot, I'm showing the BYBIT:BTCUSD part of the screener matching with the divergences on the chart
II - How did I set the screener
The visual signals are as follow:
- square: whenever a regular or hidden divergence is detected
Then the colors are:
- green when there is bullish divergence
- red when there is bearish divergence
🔔🔔 I also added the alerts for capturing those bullish/bearish divergences
III - Does it repaint?
It should not :)
Best regards
Dave